Escrow Periods

Recently I was asked by the SF Chronicle,

“How long does a typical escrow period last? What can cause it to last longer or be faster?”…..

Here’s my response:

Our typical escrow period in the San Francisco Bay area for a mortgage funded purchase is between 24 and 30 days.  That being said, there are as many variables as there are documents in a transaction and individually all or one can prolong an escrow. Whether or not the buyer  is pre-approved vs underwritten can determine how long the final review of the file will take before loan documents are sent to Title.  The primary difference between the two distinctions is that only through underwriting are all financial documents reviewed by the lender, ie: tax returns, filing matters, credit worthiness, etc.  A pre-approval is a precursory review of your credit score and is in no way an in-depth assessment. In fact after a through analysis lenders can actually disallow what they had previously pre-approved a buyer for. Very rarely do they come back approving you for a higher purchase level. More often than not the amount of the mortgage you qualify for is lower. This can be very disconcerting for a buyer and troublesome for an escrow’s closing. Lenders have different regulations either internally predetermined or federally written that can effect the time period of an escrow.  If the buyer’s lender is handicapped with rigid federal restrictions, last minute demands can literally halt the forward progression of a purchase.  Complicating not only the immediate escrow but possibly other escrows that hinge on the sale.

In addition some lenders require, as a condition for closing, that repairs on the property be completed.  Another example of an extended escrow could be missing signatures on pertinent documents. Thorough review of all signatures and initials required on contractual paperwork is occasionally only scrutinized during the final stages of underwriting.  Although simplistic in theory this can be monumentally important to the successful close of an escrow.  Having an experienced agent aware of all aspects of a transaction is of paramount importance when buyer or selling your home. Agents deal with real estate transactions on a daily basis.  Most home owners buy and sell property every 5 – 7 years and cannot possibly be up to date on all the requirements and disclosures we as agents are required to provide in today’s home sales.

The fastest close is cash with no contingencies. My fastest close was 3 days!


Luxury Property Market – Christie’s CEO

Christie’s International Real Estate CEO Talks to the NYT

Recently, Christie’s CEO Bonnie Stone Sellers spoke to the New York Times about the future of the powerhouse company, and how it’s success is driven by the success of the affiliates.

Ms. Sellers is the chief executive of Christie’s International Real Estate, the New York-based division of the auction house Christie’s. The company has 138 real estate affiliates in 45 countries, including Brown Harris Stevens.

Before joining Christie’s in September 2012, she served as the head of the real estate group at McKinsey & Company, where she was a partner for 14 years.
Interview conducted and condensed by VIVIAN MARINO

Q. How does the New York market factor into the overall business at Christie’s International?

A. There isn’t any one affiliate that is that major a factor, but New York is a very important location for us. A lot of our major transactions are in the New York market. Since I’ve been with Christie’s International Real Estate, our network’s biggest transaction in New York City was through our affiliate Brown Harris Stevens: an $88 million apartment at 15 Central Park West bought by a Russian oligarch in 2012.

Q. Have you added affiliates since you came to the helm?

A. We’ve added 18 affiliates, some of which are in really key areas — from Singapore to Dubai; Monaco; Orange County, Calif.; Honolulu, just to name a few.

As a result of this and as a result of the strength of the luxury market, our growth has been substantial.

Q. How so?

A. In 2013, we had a sales volume of $106 billion. That reflected a 29 percent growth over the previous year of about $82 billion.

Q. What is your forecast for this year?

A. We’re looking for a bigger number.

Q. Your company recently published its second annual study of the global luxury market. Any surprises?

A. The big surprise for us was the velocity of sales. We had no idea that the growth in the luxury market was related to the volume of sales, in particular, rather than the increase of prices. The second big “aha!” to us in our research — and we do all the research ourselves, by the way — was that luxury real estate has no relationship to general housing. It bears a very close relationship to luxury goods, particularly fine art. And if you look at how well the auction house did this past year, it kind of proves the point. Many have multiple pieces of art, and multiple homes.

Q. Are there just more rich people around?

A. There are a lot more rich people, and the rich people have more wealth — this had been in many public reports. But to us, we see three groups driving this.

The first group that everyone hears about is the foreigners. They invest in London and the United States and they do that to have a safe place for their capital, a place where they can eventually live when they want to send their children to school; a place that has ease of access — a lifestyle city.

A second group are the millennials. This is a generation that for the first time is receiving money from their baby-boomer parents or perhaps they were in the tech area and they’ve earned their own money. They’re becoming a noticeable force in the market.

But the third group — the real driver — is the locals. And this is not just focused on New York but all the major cities we’ve looked at. The locals were on the sidelines during the recession and they’ve now come back with their pent-up demand and they’re fueling the growth of the lowest end of the luxury market — $1 million to $5 million — because finances are available and they have confidence.

Q. In the New York market, $1 million isn’t really considered luxury.

A. We actually agree with you. In the New York market, we define luxury as $5 million and above. But for our network globally, we only handle properties starting at $1 million.

Q. So if I wanted to list a home for under $1 million, you wouldn’t market it?

A. Our affiliates may take it, but not under the Christie’s network.

Q. Are you working directly with any big developments?

A. You caught us just before we announced the business — we’re going to be launching it this summer.

One of the new initiatives this year is to create a business in development project marketing. We have three projects under our belt already. The one we are about to launch is in Sardinia; we also have two projects in London.

Q. Where would you like to see the company in the next few years?

A. We have some bold aspirations in the next five to 10 years. First: geographic expansion. We need to be in every major luxury city in the world, and there are still a few that we haven’t yet tackled. There are several in Asia that we’re testing the waters on right now — for example, Tokyo.

I’d like to deepen synergies with the auction house. This year we had the opportunity to market and sell the properties of Huguette Clark. She died, a copper heiress, with four properties in the New York area — three on Fifth Avenue, sold together with our affiliate Brown Harris Stevens — and one in Connecticut. In addition, we sold a lot of the art in the homes, jewelry and in the most recent auction, the Monet “Water Lilies.” So it came full circle: the art and the real estate together. It was a perfect synergy.

Bay Area Home Price Sales ~ May


Bay Area Home Prices ~ Still short of 2007 highs!

money fence_sm


While April median home prices across California and the Bay Area returned to levels not seen since late 2007, they remain well short of pre-recession peaks.

But a different story emerges when comparing historical and recent median prices in our individual Bay Area counties. Indeed, some counties have actually surpassed their precrisis price highs, others are nearly there, and still others have a longer road to recovery.

Whether you’re buying or selling a home in the Bay Area, staying informed on both current and past prices can help you decide when to act. Here’s an analysis, based on California Association of Realtors data, that compares April median single-family home prices across Bay Area counties with their historical highs.

Alameda County – At $718,580 the median price in Alameda County is just 0.5 percent short of its all-time high. The Alameda County median peaked in May 2007 at $722,044.

Contra Costa County – Housing prices in Contra Costa County have been rising steadily since January and reached $755,950 in April. The current median price is 18 percent lower than it was in June 2006, when it topped out at $923,855.

Marin County – Marin is one of just two Bay Area counties where the median home price was higher than the $1 million mark in April. Still, at $1,007,580, the current median is 12 percent below its historical high of $1,149,390, set in June of 2007.

Napa County – The median price in Napa County declined from March to April to land at $523, 150. In August 2006, prices in the county hit $729,166, 28 percent above current levels.

San Francisco County – San Francisco home prices actually reached all-time highs in February 2014 but have since slightly cooled to $940,570. San Francisco is one of two local markets where prices have now surpassed their prerecession highs, currently 0.9 percent higher than they were in May 2007.

San Mateo County – San Mateo County bested its previous peak median in March before falling to $1,001,000 in April. The county median is now 2 percent below its October 2007 precrisis pinnacle of $1,020,000.

Santa Clara County – The median price in Santa Clara County reached $900,000 for the first time ever in April, buoying the market 5 percent above its previous all-time high of $865,000, achieved in October 2007.

Photo: Flickr/Tax Credits)

Pacific Union


Luxury Home Sales 2014 -Bay Area Leader

presidio_heights

Luxury home sales volumes grew by double-digit percentage points in the first quarter of 2014 in nine of the Northern California regions. Redfin‘s 2014 Luxury Report shows that three Bay Area regions are leading the nation in high-end home sales growth this year.

Luxury homes are defined as those in the most expensive 1 percent of properties. In the U.S. metropolitan areas high end home sales were up 21% in the first four months of 2014.Redfin further reported that San Francisco had the most expensive luxury-home prices in the Country. The minimum amount a San Francisco buyer would need to purchase a luxury priced home would be $5.35 million — not to mention earn $916,000 per year and make monthly mortgage payments of more than $21,000, assuming a 30-year, fixed-rate loan.

San Jose was 2nd with luxury homes sales increases of 91%. Ranking fourth in the country for highest minimum luxury home pricing of $3.38 million. San Francisco and San Jose placed among the top 10 markets with the highest percentage of all-cash luxury sales, 55.7 and 48.8 percent respectively.

Which neighborhoods are tops? In San Francisco it’s Presidio Heights – average luxury home cost of $7.5 million. Pacific Heights – average luxury home cost of $7.2 million and Russian Hill – average luxury home cost of $6.5 million.

In San Jose – technically Old Palo Alto – average luxury home cost of $4.7 million (although as of today it looks like more like $6 million for a Professorville tear down!) Movoto just named Palo Alto the second wealthiest small city in the U. S. Menlo Park was fifth.

Investment – Real Estate vs Gold ?

Real estate ranks ahead of gold, stocks, bonds, or savings accounts as the best long-term investment today, according to a nationwide poll by the Gallup organization. It’s also a lot more enjoyable on a daily basis. It houses our family, envelopes our possessions, features our holidays, welcomes us home, cushions our falls and celebrates our joys! These are returns that are intangible and not financially measurable however they provide a wealth of return and solace to a family!

Thirty percent of Americans named real estate their best investment option in the poll, which was conducted earlier this month. Real estate has been rising steadily in Gallup’s annual investment polls since 2011, when only 19 percent of Americans viewed it favorably.

Rising home prices and growing stability in real estate markets are credited for much of the change in perception.

Gold was the No. 1 investment option in 2011, when 34 percent of poll respondents named it their favorite. Gold was at its highest market price at the time, but prices have dropped significantly since then.

In the latest poll, gold and stocks tied for second place behind real estate, at 24 percent, followed by savings accounts (14 percent) and bonds (6 percent).

Real estate has ranked first among investment options in previous years — 50 percent of poll respondents picked it as their top choice in 2002, as markets boomed — but it fell out of favor during the subprime mortgage crisis and recession.

Real estate’s recovery has been underway for more than a year, with Bay Area markets at the national forefront. The San Jose and San Francisco metropolitan areas were recently identified as having the highest home equity levels in the nation, and another report named the metro areas the No. 1 and 2 best markets for home sellers.

Pacific Union’s just-released Real Estate Report for the first quarter of 2014 provides detailed summaries of activity in each of our nine Northern California markets. In March, median single-family home prices reached yearly highs in most regions and topped $1 million in San Francisco and Marin County. Farther south in our Silicon Valley region, home prices surpassed the $2.5 million mark.

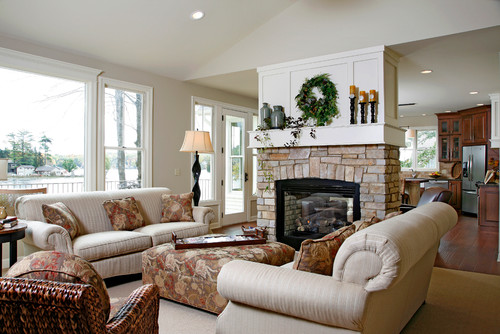
Photo Courtesty of Houzz & Traditional Living Room by Rockford Interior Designers & Decorators Gallery Interiors and Rockford Kitchen Design.  Excerpt from Pac Union.

Home Remodeling Costs

Rough Estimates for Mid Range Home Remodeling

Cost vs Resale Comparison and Percentage Value Recouped

PROJECT Job Cost Resale Recoup
Attic Bedroom $47,919 $34,916 72.9%
Backup Power Generator $11,410 $6,014 52.7%
Basement Remodel $61,303 $43,095 70.3%
Bathroom Addition $37,501 $20,569 54.8%
Bathroom Remodel $15,782 $10,295 65.2%
Deck Addition (composite) $15,084 $10,184 67.5%
Deck Addition (wood) $9,327 $7,213 77.3%
Entry Door Replacement (fiberglass) $2,753 $1,813 65.9%
Entry Door Replacement (steel) $1,137 $974 85.6%
Family Room Addition $79,006 $50,013 63.3%
Garage Addition $48,806 $31,091 63.7%
Garage Door Replacement $1,496 $1,132 75.7%
Home Office Remodel $27,292 $11,911 43.6%
Major Kitchen Remodel $53,931 $37,139 68.9%
Master Suite Addition $101,873 $64,390 63.2%
Minor Kitchen Remodel $18,527 $13,977 75.4%
Roofing Replacement $18,488 $11,633 62.9%
Siding Replacement (vinyl) $11,192 $8,154 72.9%
Sunroom Addition $72,179 $33,529 46.5%
Two-Story Addition $152,470 $99,674 65.4%
Window Replacement (vinyl) $9,770 $6,961 71.2%
Window Replacement (wood) $10,708 $7,852 73.3%

As compiled in the Remodeling 2014 Cost vs. Value Report ( www.costvsvalue.com)

Demand down for Home Loans & Refi’s

With the recent policy change announced by the Fed in regard to reducing it’s bond purchases, interest rates have gradually ticked up in anticipation. For the first fiscal quarter of 2014 mortgage lending declined to the lowest level in 14 years with the largest decline measured in the refinancing market. Loans for new home purchases were for the most part unchanged during the first part of 2013 but did dip down during the 4th quarter.

According to Inside Mortgage Finance as reported by Nick Timiraos of the WSJ, lenders funded $235 billion in mortgage loans during the period January – March 2014 which is a dramatic 58% decrease from the same period last year and a 23% decrease from the last quarter of 2013.

The sluggishness of the housing market could very well be an indicator of the anemia of the economy in general. When the housing market is strong GDP growth begins to improve. The softness in the housing market could be indicative of low wage and job growth. Consumers are unwilling to purchase homes at higher prices with money that is more costly than it was 6 months ago. When your dollar buys less the consumer stops buying, especially the investor.

If the Fed envisioned the housing market as it’s initial catalyst to boost the economy these figures might be cause to reconsider. Refinancing fell 75% during the first quarter of 2014 in comparison to the same period of time in 2013 according to Inside Mortgage Finance. “Refinancing has made up on average more than 40% of all mortgage lending since 2000,  it fell to 47% of all mortgage lending in the first quarter, compared with 78% a year earlier.” Nick Timiraos, WSJ

Lenders facing this challenging market, in an attempt to bolster numbers are restructuring the requirements for new home loan qualifications by easing the standards they had recently adopted after the Fannie Mae Freddie Mac fiasco. Loosening underwriting however might not ease the mortgage decline if consumers buying power has been decreased due to damaged credit, insufficient income due to job loss or cut backs.

The decrease in loan purchases and refinancing however might be indicative of a broader picture of economic uncertainty and true unemployment figures.
* Excerpts from WSJ article by Nick Timiraos and Eric Morath

Market Trends 2013 -2014

Chart

Not surprising the housing market in the Bay Area can be overwhelming if you are a buyer.  The chart above reflects the average days on the market for a single family home in the past calendar year. Even though these are averages, with the majority of sales completed short of a month, if you aren’t on top of the market and know what you are competing with you might have to make 3 or 4 offers on homes before you are successful. For instance, are you competing with cash buyers or buyers that have a large down payment. Are your competitors closing quickly or are they offering incentives to the seller? It doesn’t take but a few losses to figure out what it will take to be successful.

Also of note, the Sale Price to List Price ratio reflects that the average home price sold during the last year was at least 6.5% above the listed price. Coincidentally March of 2013 and March 2014 are almost exactly the same at 10.5% and 10% overages respectfully. What I did find encouraging is that the average overages, 10%,  weren’t astronomical. That amount is still within a conservative margin for lenders to value appreciation especially when the media is reporting housing price sales are up  35% from last year.

Just a note of caution. The past correction in the Housing Market started with a drop in the stock market yielding loss of income by market investors. Constricted home budgets then caused mortgage delinquencies which resulted in many foreclosures. In effect glutting the housing market with more supply than demand. When this happens home prices fall. Does history repeat itself?  For now we have low inventory, a bevy of buyers and the result is an increase in home sale prices. Great for Sellers, it’s a Sellers’ Market….but remember in a blink of an eye….the tables can turn and then it’s a Buyers’ Market.